


-
摘要:
针对散斑噪声对合成孔径雷达(SAR)图像变化检测精度影响大、现有基于胶囊网络的图像变化检测方法网络模型复杂度高、训练样本丢失大量原始图像信息等问题,提出了一种基于轻量胶囊网络的自监督图像变化检测方法。生成对数比值算子差异图,通过最大类间方差法和模糊C均值聚类算法,获得高置信度的训练样本“伪标签”,为实现自监督学习奠定基础;构造基于两时相SAR图像和对数比值算子差异图的三通道训练样本,最大限度保留样本信息;设计轻量胶囊网络,通过单尺度卷积提取训练样本特征,采用单尺度胶囊网络挖掘特征之间的空间关系;设置对比实验和消融实验,在5个真实SAR数据集上进行测试。实验结果表明:所提方法在降低模型复杂度的条件下,提高了运行效率,获得了更强的鲁棒性特征,抑制了散斑噪声对变化检测效果的不利影响,提升了变化检测效果。
Abstract:In response to the significant impact of speckle noise on the detection accuracy of synthetic aperture radar (SAR) image changes, the high network model complexity of existing capsule network-based image change detection methods, and the loss of a large amount of original image information in training samples, this paper proposed a self-supervised image change detection method based on the light capsule network (SLCapsNet). The logarithmic ratio operator difference graph was generated, and the “pseudo label” of training samples with high confidence was obtained through the maximum inter-class variance method and fuzzy C-means clustering method, which laid the foundation for self-supervised learning. The paper constructed a three-channel training sample based on the two temporal SAR images and difference graph of logarithmic ratio operators to maximize the preservation of sample information. Lightweight capsule network was designed to extract training sample features through single scale convolution, and a single scale capsule network was used to mine spatial relationships between features. Comparative experiments and ablation experiments were set up, and tests were conducted on five real SAR datasets. The experimental results show that the advantage of the proposed method is to improve the operational efficiency of the method while reducing model complexity, obtain stronger robust features, suppress the adverse impact of speckle noise on change detection performance, and improve change detection performance.
-

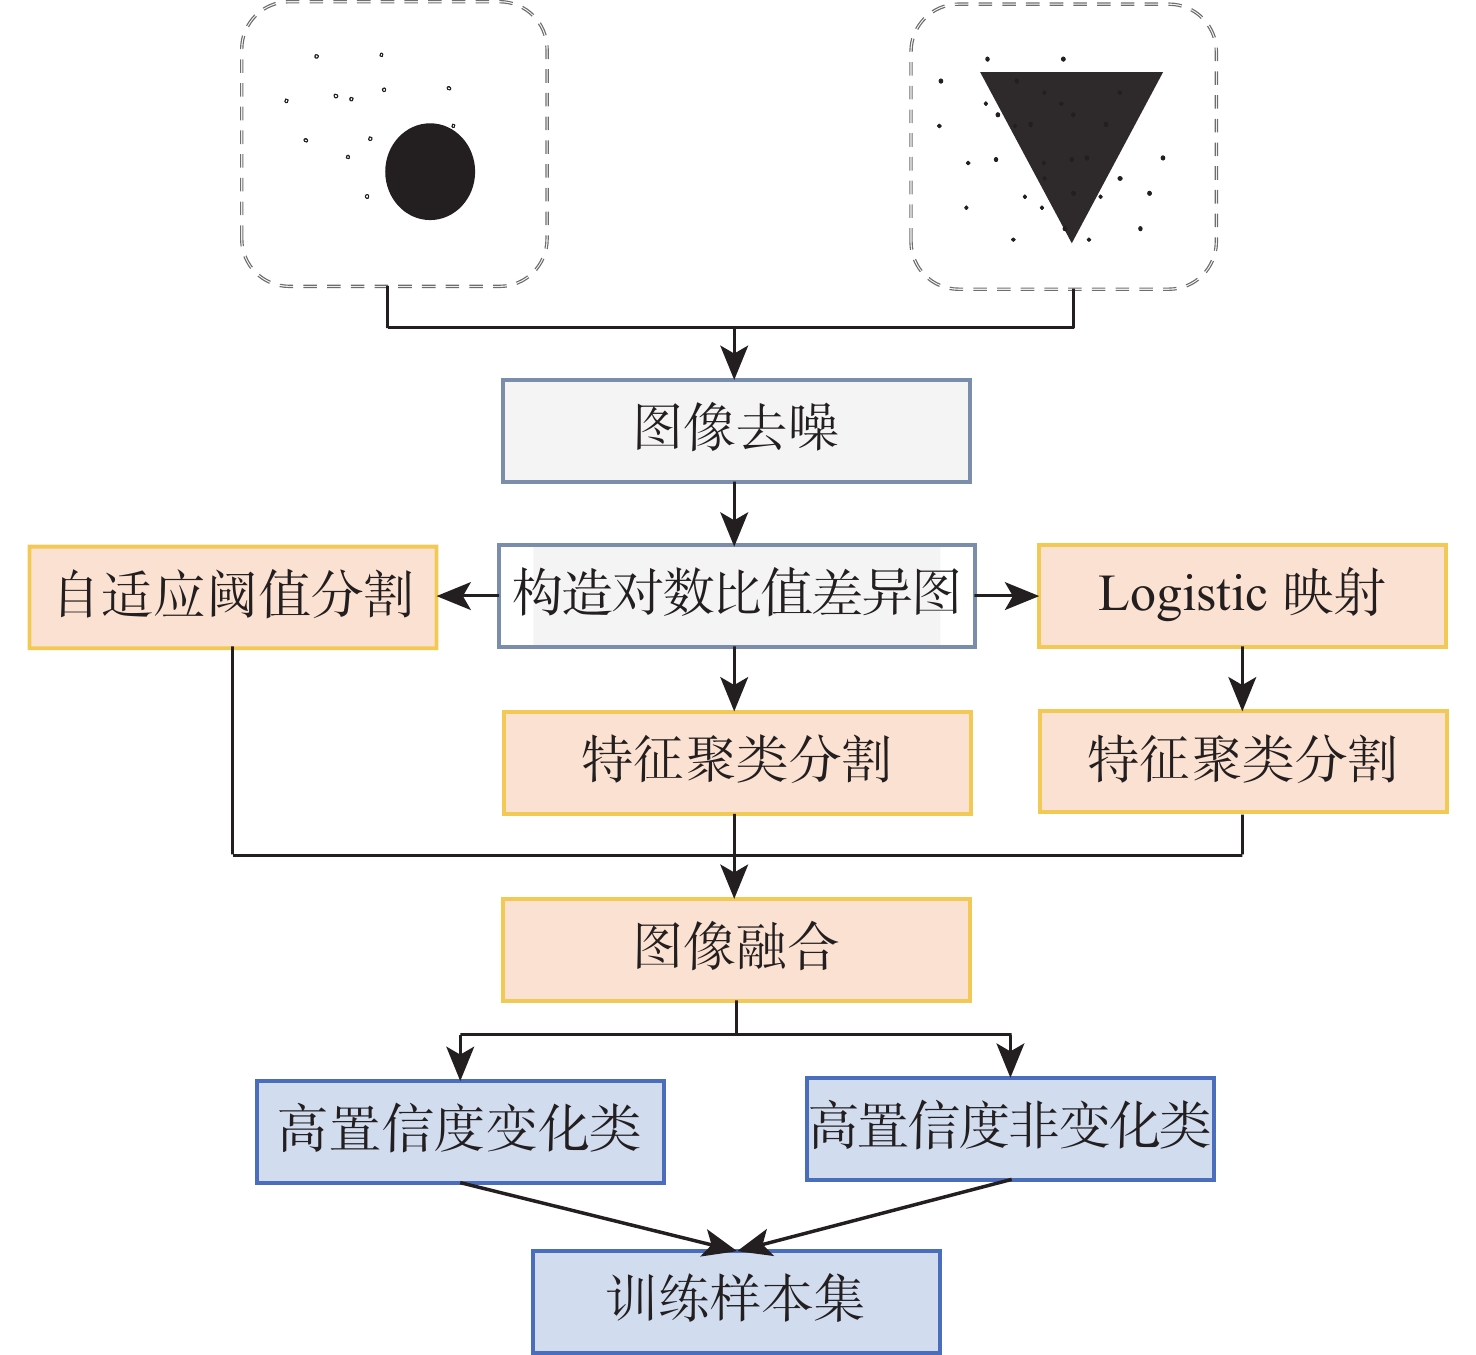
图 1 基于图像融合的图像变化检测标记方法流程
Figure 1. Flow chart of image change detection and labeling method based on image fusion

图 3 基于两时相SAR图像和差异图的训练样本构造方式示意图
Figure 3. Training sample construction based on two temporal SAR images and difference maps

图 5 分类正确率随邻域大小的变化曲线
Figure 5. Curves of correct classification rate with neighborhood size

图 6 旧金山数据集中各种变化检测方法的可视化结果
Figure 6. Visualization results of various change detection methods in San Francisco Dataset

图 7 黄河海岸线数据集中各种变化检测方法的可视化结果
Figure 7. Visualization results of various change detection methods in Yellow River Coastline Dataset

图 8 黄河内陆水域数据集中各种变化检测方法的可视化结果
Figure 8. Visualization results of various change detection methods in Yellow River Inland Water Area Dataset

图 9 黄河农田数据集中各种变化检测方法的可视化结果
Figure 9. Visualization results of various change detection methods in Yellow River Farmland Dataset

图 10 贵州数据集中各种变化检测方法的可视化结果
Figure 10. Visualization results of various change detection methods in Guizhou Dataset

图 11 黄河内陆水域数据集上不同训练样本构造方式的Kappa系数和F1分数柱状图
Figure 11. Histograms of Kappa coefficients and F1 scores for different training sampl construction methods on Yellow River Inland Water Area Dataset

图 12 黄河农田数据集上不同训练样本构造方式的Kappa系数和F1分数柱状图
Figure 12. Histograms of Kappa coefficients and F1 scores for different training sample construction methods on Yellow River Farmland Dataset

图 13 贵州数据集上不同训练样本构造方式的Kappa系数和F1分数柱状图
Figure 13. Histograms of Kappa coefficients and F1 scores for different training sample construction methods on Guizhou Dataset

图 14 多个数据集上不同训练样本构造方式的Kappa系数和F1分数柱状图
Figure 14. Histograms of Kappa coefficients and F1 scores for different training sample construction methods on multiple datasets
表 1 数据集信息
Table 1. Information for datasets
数据集名称 场景 第1时相 第2时相 旧金山 洪水突发 2003年8月 2004年5月 黄河海岸线 河水冲击 2008年6月 2009年6月 黄河内陆水域 河水冲击 2008年6月 2009年6月 黄河农田 农田耕种 2008年6月 2009年6月 贵州 建筑物变化 2016年6月 2017年4月  下载: 导出CSV
表 4 对黄河内陆水域数据集的客观评价
Table 4. Objective evaluation of Yellow River Inland Water Area Dataset
下载: 导出CSV
表 7 SLCapsNet的消融实验
Table 7. Ablation experiment results of SLCapsNet
方法 模型 伪标签 样本构
造方式平均
用时/sKappa系数/% 黄河
海岸线黄河
农田贵州 1 MsCapsNet × nrnrnr 413.6 88.08 89.67 17.63 2 SLCapsNet × nrnrnr 179.0 74.61 85.64 36.49 3 SLCapsNet √ nrnrnr 179.0 89.40 89.27 57.33 4 SLCapsNet × im1im2log 179.0 74.72 86.84 37.81 5 SLCapsNet √ im1im2log 179.0 89.71 89.95 69.53
下载: 导出CSV
-
[1] 刘国强, 房胜, 李哲. 用于遥感图像变化检测的全尺度特征聚合网络[J]. 北京麻豆精品秘 国产传媒学报, 2022, 48(8): 1464-1470.LIU G Q, FANG S, LI Z. A full-scale feature aggregation network for remote sensing image change detection[J]. Journal of Beijing University of Aeronautics and Astronautics, 2022, 48(8): 1464-1470(in Chinese). [2] 周圆, 李祥瑞, 杨晶. 基于混合网络的异源遥感图像变化检测[J]. 北京麻豆精品秘 国产传媒学报, 2021, 47(3): 451-460.ZHOU Y, LI X R, YANG J. Heterogeneous remote sensing image change detection based on hybrid network[J]. Journal of Beijing University of Aeronautics and Astronautics, 2021, 47(3): 451-460(in Chinese). [3] GONG M G, ZHAO J J, LIU J, et al. Change detection in synthetic aperture radar images based on deep neural networks[J]. IEEE Transactions on Neural Networks and Learning Systems, 2016, 27(1): 125-138. doi: 10.1109/TNNLS.2015.2435783 [4] GAO F, DONG J Y, LI B, et al. Automatic change detection in synthetic aperture radar images based on PCANet[J]. IEEE Geoscience and Remote Sensing Letters, 2016, 13(12): 1792-1796. doi: 10.1109/LGRS.2016.2611001 [5] LI M K, LI M, ZHANG P, et al. SAR image change detection using PCANet guided by saliency detection[J]. IEEE Geoscience and Remote Sensing Letters, 2019, 16(3): 402-406. doi: 10.1109/LGRS.2018.2876616 [6] WANG S N, WANG Y N, LIU Y, et al. SAR image change detection based on sparse representation and a capsule network[J]. Remote Sensing Letters, 2021, 12(9): 890-899. doi: 10.1080/2150704X.2021.1946199 [7] ZHANG X Z, SU H, ZHANG C, et al. Robust unsupervised small area change detection from SAR imagery using deep learning[J]. ISPRS Journal of Photogrammetry and Remote Sensing, 2021, 173: 79-94. doi: 10.1016/j.isprsjprs.2021.01.004 [8] SABOUR S, FROSST N, HINTON G E, et al. Dynamic routing between capsules[C]//Proceedings of the 31st International Conference on Neural Information Processing Systems. New York: ACM, 2017: 3859-3869. [9] GONG M G, YANG H L, ZHANG P Z. Feature learning and change feature classification based on deep learning for ternary change detection in SAR images[J]. ISPRS Journal of Photogrammetry and Remote Sensing, 2017, 129: 212-225. doi: 10.1016/j.isprsjprs.2017.05.001 [10] FERRETTI A, MONTI-GUARNIERI A, PRATI C, et al. InSAR principles: guidelines for SAR interferometry processing and interpretation[M]. Noordwijk: ESA Publications, 2007. [11] YU S Q, JIA S, XU C Y. Convolutional neural networks for hyperspectral image classification[J]. Neurocomputing, 2017, 219: 88-98. doi: 10.1016/j.neucom.2016.09.010 [12] GAO Y H, GAO F, DONG J Y, et al. SAR image change detection based on multiscale capsule network[J]. IEEE Geoscience and Remote Sensing Letters, 2021, 18(3): 484-488. doi: 10.1109/LGRS.2020.2977838 [13] BOVOLO F, BRUZZONE L. A detail-preserving scale-driven approach to change detection in multitemporal SAR images[J]. IEEE Transactions on Geoscience and Remote Sensing, 2005, 43(12): 2963-2972. doi: 10.1109/TGRS.2005.857987 [14] D’HAEYER J P F. Gaussian filtering of images: a regularization approach[J]. Signal Processing, 1989, 18(2): 169-181. doi: 10.1016/0165-1684(89)90048-0 [15] ZHENG Y G, ZHANG X R, HOU B, et al. Using combined difference image and K-means clustering for SAR image change detection[J]. IEEE Geoscience and Remote Sensing Letters, 2014, 11(3): 691-695. doi: 10.1109/LGRS.2013.2275738 [16] OTSU N. A threshold selection method from gray-level histograms[J]. IEEE Transactions on Systems, Man, and Cybernetics, 1979, 9(1): 62-66. doi: 10.1109/TSMC.1979.4310076 [17] LI H C, CELIK T, LONGBOTHAM N, et al. Gabor feature based unsupervised change detection of multitemporal SAR images based on two-level clustering[J]. IEEE Geoscience and Remote Sensing Letters, 2015, 12(12): 2458-2462. doi: 10.1109/LGRS.2015.2484220 [18] ROSENFELD A, PFALTZ J L. Sequential operations in digital picture processing[J]. Journal of the ACM, 1966, 13(4): 471-494. doi: 10.1145/321356.321357 [19] GAO F, WANG X, GAO Y H, et al. Sea ice change detection in SAR images based on convolutional-wavelet neural networks[J]. IEEE Geoscience and Remote Sensing Letters, 2019, 16(8): 1240-1244. doi: 10.1109/LGRS.2019.2895656 [20] ZHU K Q, CHEN Y S, GHAMISI P, et al. Deep convolutional capsule network for hyperspectral image spectral and spectral-spatial classification[J]. Remote Sensing, 2019, 11(3): 223. doi: 10.3390/rs11030223 [21] ZHANG X Z, LIU G, ZHANG C, et al. Two-phase object-based deep learning for multi-temporal SAR image change detection[J]. Remote Sensing, 2020, 12(3): 548. doi: 10.3390/rs12030548 [22] CELIK T. Unsupervised change detection in satellite images using principal component analysis and K-means clustering[J]. IEEE Geoscience and Remote Sensing Letters, 2009, 6(4): 772-776. doi: 10.1109/LGRS.2009.2025059 -

 下载:
下载:


 点击查看大图
计量
- 文章访问数: 135
- HTML全文浏览量: 18
- PDF下载量: 12
- 被引次数: 0
