


-
摘要:
基于正则广义典型相关分析理论框架,提出一类对于多元函数型数据的充分降维方法。通过积分形式,将平方可积空间中的函数型数据投影至实空间中的一系列数值变量,在整体相关性度量最大的目标准则下,同时确定这些函数型投影方向,实现多元函数型数据向传统数值变量转化的特征信息提取及快速降维过程。在一般基函数系统表示下,推导得到最优投影权重函数的迭代计算方法,该方法对于基函数系统的选取具有独立性。大量仿真结果表明,在有限样本情况下,所提方法能够有效探测多元函数型数据之间的相关关系,且对投影权重函数的估计具有一致性。关于帕金森综合征患者步态的实例数据研究表明,由函数型数据投影得到的数值特征信息具有可解释性,所提方法具有一定实用价值。
-
关键词:
- 函数型数据 /
- 正则广义典型相关分析 /
- 特征提取 /
- 函数型主成分 /
- 帕金森综合征步态
Abstract:An effective dimension reduction method for multivariate functional data is developed within the theoretical framework of regularized generalized canonical correlation analysis. Functional data in square integrable spaces is first projected in an integral form to a series of numeric variables, and those variables are then used for simultaneously determining the related projection directions of functional features by maximizing a kind of global correlation measure, which achieves the featured information extraction and rapid dimension reduction of multivariate functional data as traditional numeric variables. A general basis function system is used to create the iterative computing algorithm for the optimal functional projection weights, which is independent of the specified basis functions. A large number of simulation results for infinite samples show that the proposed method is able to detect the correlation among multivariate functional data and obtain consistent estimates for the associated functional projection weights. The real-data study on the gait of Parkinson's patients indicates the interpretability of the numeric featured information derived from the original functional data and the utility of the proposed method.
-

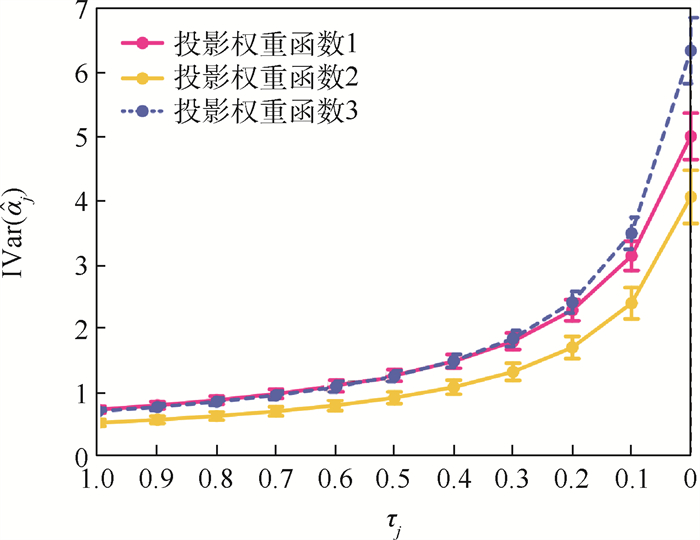
图 1 不同收缩参数下FRGCCA估计结果的Ivar折线图
Figure 1. Line chart for IVar of FRGCCA under different shrinkage parameters

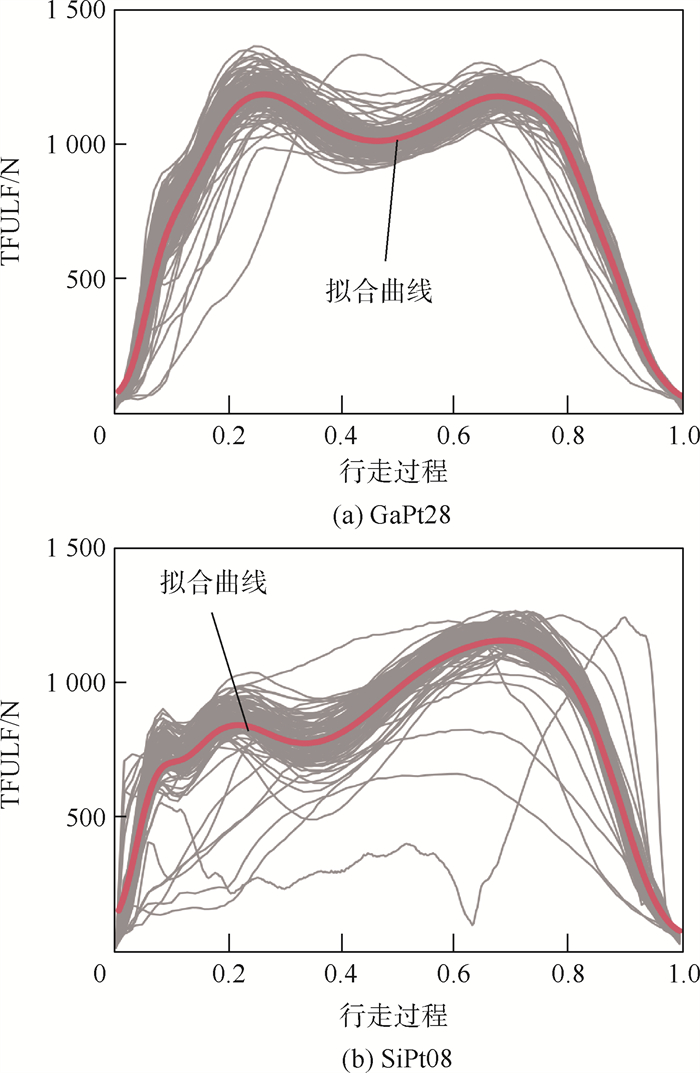
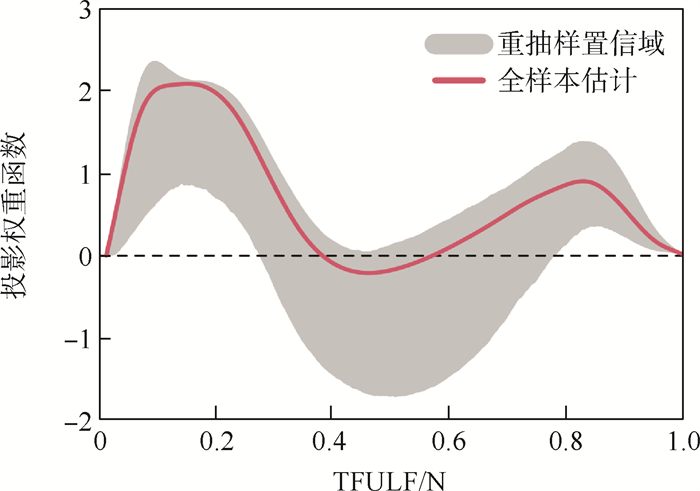
图 3 TFULF对应投影权重函数的估计曲线
Figure 3. Estimated curve of weighted integral function for TFULF
表 1 不同函数型数据样本量下FRGCCA的估计精度
Table 1. Estimation accuracy of FRGCCA under different sample sizes of functional data
投影权重函数 观测函数样本量n 基于真实基函数 累积方差贡献率阈值 0.8 0.9 0.99 200 5.361
(3.119)6.941
(4.196)6.444
(3.824)7.264
(4.103)400 2.712
(1.480)3.471
(2.001)3.108
(1.731)3.492
(1.889)α1 600 1.776
(0.982)2.341
(1.415)2.045
(1.161)2.284
(1.247)800 1.330
(0.750)1.704
(1.029)1.532
(0.881)1.712
(0.946)1 000 1.063
(0.584)1.368
(0.807)1.210
(0.665)1.362
(0.729)200 3.026
(1.682)5.141
(3.11)6.260
(3.571)7.881
(4.086)400 1.517
(0.798)2.580
(1.498)3.061
(1.621)3.791
(1.815)α2 600 1.010
(0.518)1.732
(0.968)2.003
(1.054)2.510
(1.199)800 0.765
(0.412)1.348
(0.756)1.538
(0.805)1.900
(0.916)1 000 0.596
(0.318)1.045
(0.570)1.201
(0.617)1.489
(0.701)200 3.950
(1.825)6.691
(3.351)7.440
(3.672)9.546
(4.217)400 1.986
(0.918)3.334
(1.642)3.627
(1.744)4.629
(2.033)α3 600 1.263
(0.575)2.154
(1.04)2.339
(1.140)2.975
(1.288)800 0.961
(0.439)1.629
(0.824)1.785
(0.854)2.264
(0.983)1 000 0.783
(0.364)1.309
(0.639)1.433
(0.695)1.811
(0.784)注:括号内数据为标准差。  下载: 导出CSV
表 2 不同数值观测量下FRGCCA的估计精度
Table 2. Estimation accuracy of FRGCCA under different sizes of observations
投影权重函数 观测函数样本量T 基于真实基函数 累积方差贡献率阈值 0.8 0.9 0.99 50 2.123
(1.155)23.210
(55.595)21.400
(52.681)15.536
(43.443)100 2.128
(1.116)3.963
(14.209)3.607
(13.096)3.190
(6.904)150 2.200
(1.224)3.015
(6.394)2.762
(6.367)2.858
(1.852)α1 200 2.144
(1.185)2.727
(1.589)2.487
(1.421)2.774
(1.513)250 2.060
(1.122)2.660
(1.583)2.381
(1.309)2.659
(1.417)300 2.131
(1.172)2.788
(1.606)2.489
(1.418)2.804
(1.525)50 1.229
(0.663)23.344
(56.401)22.078
(53.199)16.602
(44.76)100 1.218
(0.642)4.059
(18.798)4.093
(16.891)3.809
(11.206)150 1.219
(0.644)2.308
(6.361)2.662
(6.453)3.237
(6.366)α2 200 1.205
(0.609)2.072
(1.167)2.422
(1.260)2.993
(1.400)250 1.206
(0.625)2.091
(1.153)2.428
(1.24)3.037
(1.398)300 1.209
(0.65)2.07
(1.166)2.439
(1.262)3.026
(1.426)50 1.587
(0.770)26.611
(61.034)24.716
(58.515)15.536
(56.494)100 1.548
(0.742)3.565
(11.455)3.903
(12.044)4.771
(15.400)150 1.610
(0.747)2.779
(2.214)3.064
(2.844)3.782
(1.926)α3 200 1.591
(0.746)2.663
(1.313)2.904
(1.424)3.681
(1.571)250 1.568
(0.676)2.604
(1.202)2.866
(1.301)3.649
(1.508)300 1.594
(0.733)2.676
(1.288)2.954
(1.411)3.763
(1.633)注:括号内数据为标准差。
下载: 导出CSV
表 3 不同数值观测扰动强度下FRGCCA的估计精度
Table 3. Estimation accuracy of FRGCCA under different perturbations of observations
投影权重函数 观测函数样本量σ 基于真实基函数 累积方差贡献率阈值 0.8 0.9 0.99 0 2.124
(1.163)2.753
(1.583)2.466
(1.362)2.754
(1.493)0.2 2.140
(1.181)2.775
(1.62)2.459
(1.381)2.752
(1.493)α1 0.4 2.108
(1.180)2.742
(1.670)2.431
(1.362)2.71
(1.473)0.6 2.179
(1.200)2.882
(1.791)2.547
(1.568)2.829
(1.566)0.8 2.145
(1.205)2.77
(1.634)2.468
(1.401)2.786
(1.512)1 2.174
(1.178)3.310
(9.293)2.786
(6.482)2.886
(1.938)0 1.179
(0.610)2.038
(1.086)2.397
(1.217)2.991
(1.42)0.2 1.241
(0.648)2.144
(1.215)2.483
(1.300)3.075
(1.45)α2 0.4 1.197
(0.665)2.062
(1.225)2.408
(1.320)2.973
(1.479)0.6 1.212
(0.615)2.119
(1.205)2.433
(1.31)3.018
(1.429)0.8 1.223
(0.626)2.111
(1.172)2.461
(1.26)3.082
(1.413)1 1.214
(0.668)2.461
(6.835)2.707
(6.675)3.221
(6.436)0 1.550
(0.733)2.620
(1.309)2.872
(1.407)3.665
(1.581)0.2 1.577
(0.730)2.622
(1.287)2.896
(1.397)3.702
(1.622)α3 0.4 1.543
(0.729)2.595
(1.295)2.841
(1.434)3.654
(1.680)0.6 1.566
(0.726)2.853
(6.478)3.154
(6.499)3.732
(1.619)0.8 1.585
(0.725)2.679
(1.321)3.043
(1.462)3.758
(1.616)1 1.587
(0.731)2.938
(6.802)3.262
(6.722)3.681
(1.621)注:括号内数据为标准差。
下载: 导出CSV
表 4 Gait数据集指标变量说明
Table 4. Gait dataset indicator variables description
编号 分组名称 指标名称 属性 说明 Ⅰ 患者体型 Height 数值 患者身高 Weight 数值 患者体重 HoehnYahr 类别 患病阶段衡量 Ⅱ 患病程度 UPDRS 数值 统一评定量表得分 UPDRSM 数值 观察期UPDRS值 Ⅲ 步态特征 TUAG 数值 指令完成时间 Speed_01 数值 步行速度 Ⅳ 实时步态 TFULF 曲线 单周期左脚底压力
下载: 导出CSV
表 5 三组多元数值变量对应投影权重向量的估计结果
Table 5. Estimated results of corresponding weighted integral vectors for three multivariate groups
分组名称 指标名称 全样本估计 95%置信区间 下界 上界 患者体型 Height 0.408 0.217 0.629 Weight 0.913 0.773 0.976 HoehnYahr 0.859 0.675 0.962 患病程度 UPDRS 0.403 0.227 0.551 UPDRSM 0.316 0.106 0.551 步态特征 TUAG 0.554 0.541 0.652 Speed_01 -0.833 -0.841 -0.758
下载: 导出CSV
-
[1] RAMSAY J O. When the data are functions[J]. Psychometrika, 1982, 47(4): 379-396. doi: 10.1007/BF02293704 [2] RAMSAY J O, SILVERMAN B W. Functional data analysis[M]. Berlin: Springer, 1997. [3] CAO H, ZENG D, FINE J P. Regression analysis of sparse asynchronous longitudinal data[J]. Journal of the Royal Statistical Society: Series B(Statistical Methodology), 2015, 77(4): 755-776. doi: 10.1111/rssb.12086 [4] WANG H, LU S, ZHAO J. Aggregating multiple types of complex data in stock market prediction: A model-independent framework[J]. Knowledge-Based Systems, 2019, 164: 193-204. doi: 10.1016/j.knosys.2018.10.035 [5] WANG Z, WANG H, WANG S, et al. Linear mixed-effects model for longitudinal complex data with diversified characteristics[J]. Journal of Management Science and Engineering, 2020, 5: 105-124. [6] WU Y, FAN J, MULLER H G. Varying-coefficient functional linear regression[J]. Bernoulli, 2010, 16(3): 730-758. [7] LIAN H. Functional partial linear model[J]. Journal of Nonparametric Statistics, 2011, 23(1): 115-128. doi: 10.1080/10485252.2010.500385 [8] HARDLE W K, MULLER M, SPERLICH S, et al. Nonparametric and semiparametric modeling[M]. Berlin: Springer, 2012. [9] FERRE L, YAO A F. Functional sliced inverse regression ana-lysis[J]. Journal of the American Statistical Association, 1991, 86(414): 316-327. doi: 10.1080/01621459.1991.10475035 [10] WANG G, ZHOU J, WU W, et al. Robust functional sliced inverse regression[J]. Statistical Papers, 2017, 58: 227-245. doi: 10.1007/s00362-015-0695-x [11] REISS P T, OGDEN R T. Functional principal component regression and functional partial least squares[J]. Journal of the American Statistical Association, 2007, 102(479): 984-996. doi: 10.1198/016214507000000527 [12] TENENHAUS A, TENENHAUS M. Regularized generalized canonical correlation analysis[J]. Psychometrika, 2011, 76(2): 257-284. doi: 10.1007/s11336-011-9206-8 [13] TENENHAUS A, TENENHAUS M. Regularized generalized canonical correlation analysis for multiblock or multigroup data analysis[J]. European Journal of Operational Research, 2014, 238(2): 391-403. doi: 10.1016/j.ejor.2014.01.008 [14] TENENHAUS M, TENENHAUS A, GROENEN P J F. Regularized generalized canonical correlation analysis: A framework for sequential multiblock component methods[J]. Psychometrika, 2017, 82(3): 737-777. doi: 10.1007/s11336-017-9573-x [15] SUN M, PRIEBE C E, TANG M. Generalized canonical correlation analysis for disparate data fusion[J]. Pattern Recognition Letters, 2013, 34(2): 194-200. doi: 10.1016/j.patrec.2012.09.018 [16] TENENHAUS A, PHILIPPE C, GUILLEMOT V, et al. Variable selection for generalized canonical correlation analysis[J]. Biostatistics, 2014, 15(3): 569-583. doi: 10.1093/biostatistics/kxu001 [17] TENENHAUS A, PHILIPPE C, FROUIN V. Kernel generalized canonical correlation analysis[J]. Computational Statistical & Data Analysis, 2015, 90: 114-131. [18] LIU B, YU L, DING R X, et al. A decision-making method based on a two-stage regularized generalized canonical correlation analysis for complex multi-attribute large-group decision making problems[J]. Journal of Intelligent & Fuzzy Systems, 2018, 34(6): 3941-3953. [19] HALL P, HOROWITZ J L. Methodology and convergence rates for functional linear regression[J]. The Annals of Statistics, 2007, 35(1): 70-91. [20] SCHAFER J, STRIMMER K. A shrinkage approach to large-scale covariance matrix estimation and implications for functional genomics[J]. Statistical Applications in Genetics and Molecular Biology, 2005, 4(1): 32. [21] GOLDBERGER A L, AMRARL L A, GLASS L, et al. Physio-Bank, PhysioToolkit, and PhysioNet: Components of a new research resource for complex physiologic signals[J]. Circulation, 2000, 101(23): 215-220. -

 下载:
下载:

 点击查看大图
计量
- 文章访问数: 640
- HTML全文浏览量: 167
- PDF下载量: 46
- 被引次数: 0
