


Decomposition of logarithm mean square error of weighted geometric mean combined forecasting method
-
摘要:
针对非线性的加权几何平均组合预测模型,引入对数均方误差,并提出了对数均值偏差、模型解释力系数、对数离差误差方差及预测方法差异性测度等概念。在此基础上,将组合预测对数均方误差分解为对数均值偏差、因模型解释力不足而产生的对数方差以及基于模型解释力系数的对数离差方差3个组成部分,从理论上探讨了对数均方误差的来源。同时,将组合预测对数均方误差分解为单项预测方法对数均方误差的加权平均和预测方法差异性测度的加权平均两部分,获得了有益的结论:提高单项预测方法的精度和预测方法差异性测度水平有利于减少加权几何平均组合预测方法的对数均方误差,为组合预测单项方法的遴选提供了理论支持。通过实际案例,分析了各组成部分以及单项预测方法之间的差异性测度对组合预测对数均方误差的影响。
Abstract:In addition to proposing the ideas of logarithm mean deviation, logarithm explanatory power coefficient, logarithm deviation error variance, and diversity measure of prediction methods, the nonlinear weighted geometric mean combination prediction model was introduced to the logarithm mean square error. On this basis, the logarithm mean square error of the combined prediction is decomposed into three components: the logarithm mean error, the logarithm variance due to the insufficient explanatory power of the model and the logarithm deviation variance based on the logarithm explanatory power coefficient. The source of the logarithm mean square error is discussed theoretically. Simultaneously, the logarithm mean square error of combination forecasting is broken down into the weighted average of the logarithm mean square error of single forecasting methods and the weighted average of diversity measure of forecasting methods. This yields the helpful conclusion that increasing the accuracy of single forecasting methods and the diversity measure level of forecasting methods helps to lower the logarithm mean square error of weighted geometric mean combined forecasting methods. A case study analyzed the influence of the diversity measure of each component and single forecasting method on the logarithm mean square error of combined forecasting.
-
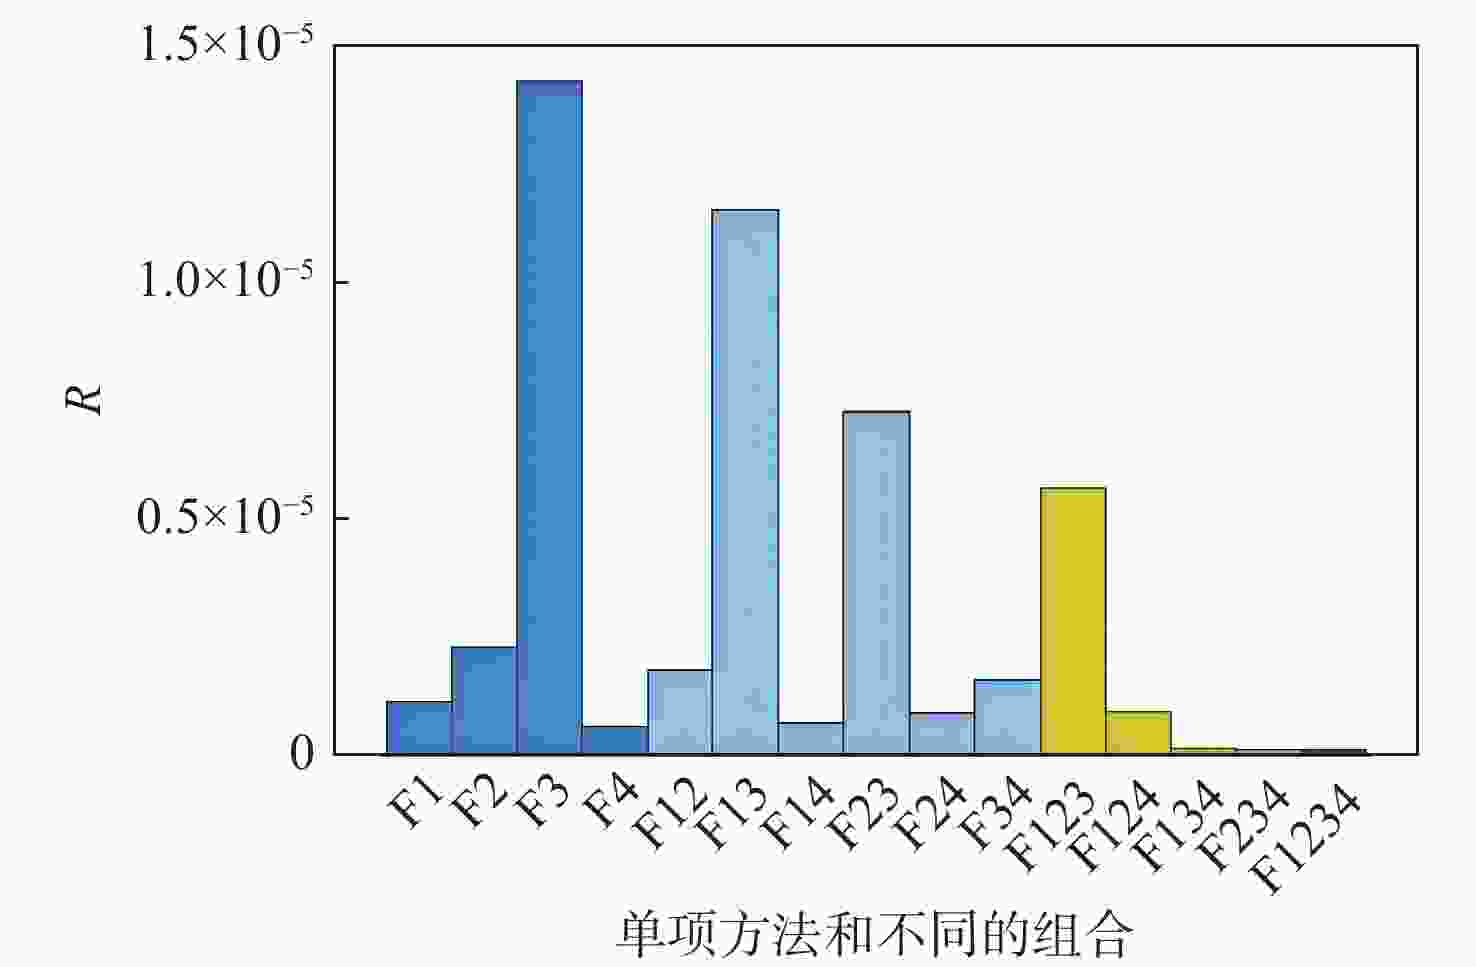
图 3 因模型解释力不足而产生的对数方差R
Figure 3. Logarithmic variance due to insufficient explanatory power of the model R
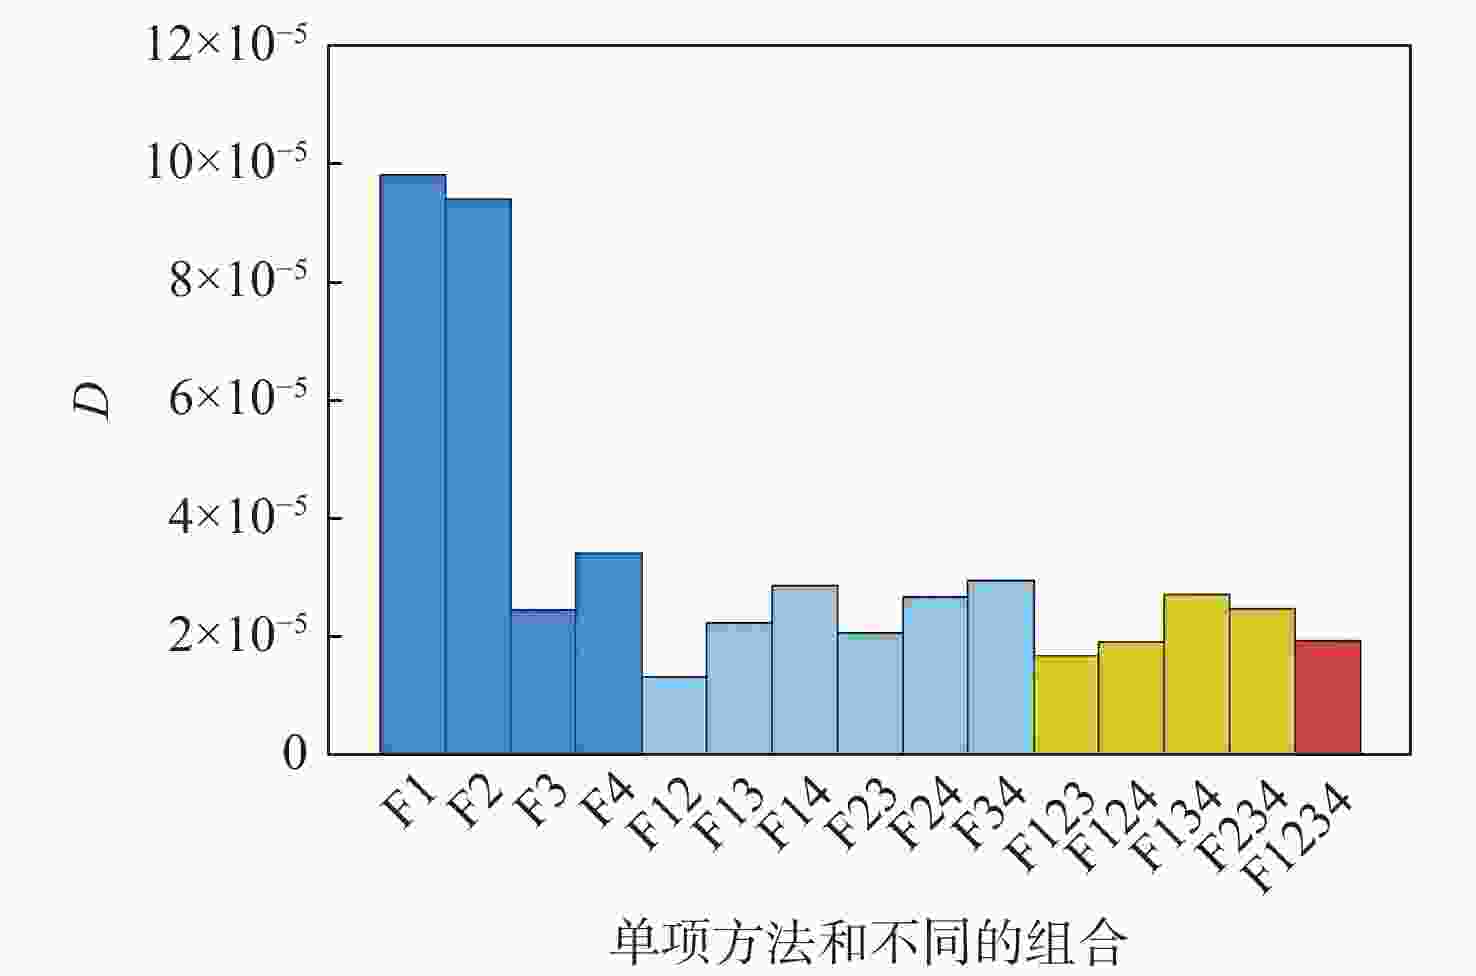
图 4 基于解释力系数的对数离差误差D
Figure 4. Logarithmic deviation error based on explanatory power coefficient D
表 1 实际值及单项方法预测值
Table 1. Actual value and predicted value of single method
实际值 预测值 F1 F2 F3 F4 6 278 6 335 6 280 6 325 6 256 6 325 6 379 6 321 6 372 6 311 6 369 6 370 6 454 6 419 6 362 6 410 6 415 6 522 6 466 6 415 6 461 6 660 6 459 6 512 6 467 6 516 6 663 6 514 6 559 6 519 6 593 6 736 6 590 6 605 6 571 6 676 6 683 6 792 6 651 6 624 6 741 6 858 6 725 6 696 6 676 6 795 6 822 6 904 6 742 6 728 6 827 6 963 6 835 6 787 6 780 6 876 6 996 6 844 6 832 6 833 6 902 6 914 7 051 6 877 6 885 6 929 7 067 6 926 6 922 6 937 6 936 6 931 7 122 6 966 6 989 6 949 7 117 6 948 7 010 7 041  下载: 导出CSV
表 2 对数误差
Table 2. Logarithmic error
e1 e2 e3 e4 −0.009 0 −0.000 3 −0.007 5 0.003 5 −0.008 5 0.000 6 −0.007 4 0.002 2 −0.000 2 −0.013 3 −0.007 8 0.001 1 −0.000 8 0.017 3 −0.008 7 −0.000 8 −0.030 3 0.000 3 −0.007 9 −0.000 9 −0.022 3 0.000 3 −0.006 6 −0.000 5 −0.021 5 0.000 5 −0.001 8 0.003 3 −0.001 0 −0.017 2 0.003 8 0.007 8 −0.017 2 0.002 4 0.006 7 0.009 7 −0.004 −0.015 9 0.007 8 0.009 9 −0.019 7 −0.001 2 0.005 9 0.006 9 −0.017 3 0.004 7 0.006 4 0.006 3 −0.001 7 −0.021 4 0.003 6 0.002 5 −0.019 7 0.000 4 0.001 0 −0.001 2 0.000 7 −0.026 5 −0.004 3 −0.007 6 −0.023 9 0.000 1 −0.008 7 −0.013 2
下载: 导出CSV
表 3 对数均方误差及其分解指标
Table 3. Log-mean-square error and its decomposition index
方法 L B R D F1 24.983 8×10⁻⁵ 15.075 5×10⁻⁵ 0.115 7×10⁻⁵ 9.792 6×10⁻⁵ F2 13.826 1×10⁻⁵ 4.201 4×10⁻⁵ 0.228 4×10⁻⁵ 9.396 4×10⁻⁵ F3 4.130 3×10⁻⁵ 0.253 6×10⁻⁵ 1.428 4×10⁻⁵ 2.448 3×10⁻⁵ F4 3.812 1×10⁻⁵ 0.331 9×10⁻⁵ 0.063 0×10−5 3.417 2×10⁻⁵ F12 8.831 1×10⁻⁵ 7.317 6×10⁻⁵ 0.183 7×10⁻⁵ 1.329 7×10⁻⁵ F13 3.991 1×10⁻⁵ 0.588 6×10⁻⁵ 1.156 4×10⁻⁵ 2.246 0×10−5 F14 2.967 3×10⁻⁵ 0.025 0×10−5 0.070 6×10⁻⁵ 2.871 7×10⁻⁵ F23 3.461 1×10⁻⁵ 0.670 3×10⁻⁵ 0.729 5×10⁻⁵ 2.061 2×10⁻⁵ F24 2.766 4×10⁻⁵ 0.001 9×10⁻⁵ 0.092 8×10⁻⁵ 2.671 7×10⁻⁵ F34 3.128 4×10⁻⁵ 0.007 6×10⁻⁵ 0.163 3×10⁻⁵ 2.957 5×10⁻⁵ F123 3.346 9×10⁻⁵ 1.097 8×10⁻⁵ 0.568 7×10⁻⁵ 1.680 4×10⁻⁵ F124 2.274 0×10−5 0.268 7×10⁻⁵ 0.094 5×10⁻⁵ 1.910 8×10⁻⁵ F134 2.788 0×10−5 0.063 3×10⁻⁵ 0.016 4×10⁻⁵ 2.708 4×10⁻⁵ F234 2.536 9×10⁻⁵ 0.054 3×10⁻⁵ 0.013 8×10⁻⁵ 2.468 8×10⁻⁵ F1234 2.249 2×10⁻⁵ 0.286 2×10⁻⁵ 0.015 1×10⁻⁵ 1.941 6×10⁻⁵
下载: 导出CSV
表 4 差异性测度的指标值
Table 4. The index value for measures of variability
差异测度 C F1,F2 3.911 30×10−4 F1,F3 2.455 35×10−4 F1,F4 3.148 69×10−4 F2,F3 1.630 16×10−4 F2,F4 1.890 72×10−4 F3,F4 0.334 08×10−4
下载: 导出CSV
-
[1] BATES J M, GRANGER C W J. The combination of forecasts[J]. Journal of the Operational Research Society, 1969, 20(4): 451-468. doi: 10.1057/jors.1969.103 [2] ATIYA A F. Why does forecast combination work so well?[J]. International Journal of Forecasting, 2020, 36(1): 197-200. doi: 10.1016/j.ijforecast.2019.03.010 [3] SEGURA-HERAS J V, BERMÚDEZ J D, CORBERÁN-VALLET A, et al. Analysis of weighting strategies for improving the accuracy of combined forecasts[J]. Mathematics, 2022, 10(5): 725. doi: 10.3390/math10050725 [4] 唐小我, 马永开, 曾勇, 等. 现代组合预测和组合投资决策方法及应用[M]. 北京: 科学出版社, 2003.TANG X W, MA Y K, ZENG Y, et al. Modern portfolio forecasting and portfolio investment decision-making method and its application[M]. Beijing: Science Press, 2003(in Chinese). [5] 陈华友. 组合预测方法有效性理论及其应用[M]. 北京: 科学出版社, 2008.CHEN H Y. Validity theory of combined forecasting method and its application [M]. Beijing: Science Press, 2008(in Chinese). [6] 汪同三, 张涛. 组合预测: 理论、方法及应用[M]. 北京: 社会科学文献出版社, 2008.WANG T S, ZHANG T. Combinatorial forecasting: Theory, method and application[M]. Beijing: Social Sciences Academic Press, 2008(in Chinese). [7] ELLIOTT G, GRANGER C W J, TIMMERMANN A. Handbook of economic forecasting (volume1) [M]. North-Holland: Elsevier, 2006. [8] ARMSTRONG J. Principles of forecasting[M]. Boston: Kluwer Academic, 2001. [9] BUNN D W. Forecasting with more than one model[J]. Journal of Forecasting, 1989, 8(3): 161-166. doi: 10.1002/for.3980080302 [10] LV W D, QI J P. Stock market return predictability: a combination forecast perspective[J]. International Review of Financial Analysis, 2022, 84: 102376. doi: 10.1016/j.irfa.2022.102376 [11] FAMELITI S P, SKINTZI V D. Statistical and economic performance of combination methods for forecasting crude oil price volatility[J]. Applied Economics, 2022, 54(26): 3031-3054. doi: 10.1080/00036846.2021.2001425 [12] 林虹, 张永, 杨兴雨, 等. 考虑组合预测股价的泛证券投资组合选择策略[J]. 管理工程学报, 2023, 37(5): 130-141.LIN H, ZHANG Y, YANG X Y, et al. Universal portfolio selection strategy based on combination forecasting price[J]. Journal of Industrial Engineering and Engineering Management, 2023, 37(5): 130-141(in Chinese). [13] 徐小峰, 余乐安, 林姿汝, 等. 基于特征融合的生鲜商品短期销量组合预测[J]. 管理科学学报, 2022, 25(12): 102-123.XU X F, YU A L, LIN Z R, et al. Combination forecasting of short-term sales for fresh products based on feature fusion[J]. Journal of Management Sciences in China, 2022, 25(12): 102-123(in Chinese). [14] 刘金培, 张了丹, 朱家明, 等. 非结构性数据驱动的混合分解集成碳交易价格组合预测[J]. 运筹与管理, 2023, 32(3): 149-154.LIU J P, ZHANG L D, ZHU J M, et al. Unstructured data driven carbon price combined forecast based on hybrid decomposition-integration[J]. Operations Research and Management Science, 2023, 32(3): 149-154(in Chinese). [15] 陈华友. 基于相关系数的优性组合预测模型研究[J]. 系统工程学报, 2006, 21(4): 353-360.CHEN H. Research on properties of superior combined forecasting models based on correlation coefficients[J]. Journal of Systems Engineering, 2006, 21(4): 353-360(in Chinese). [16] 陈华友. 基于Theil不等系数的组合预测模型的性质[J]. 电子科技大学学报, 2004, 33(1): 105-108.CHEN H Y. Properties of combination forecasting models based on theil coefficient[J]. Journal of University of Electronic Science and Technology of China, 2004, 33(1): 105-108(in Chinese). [17] 陈华友, 盛昭瀚, 刘春林. 基于向量夹角余弦的组合预测模型的性质研究[J]. 管理科学学报, 2006, 9(2): 1-8.CHEN H Y, SHENG Z H, LIU C L. Research on properties of combination forecasting model based on vectorial angle cosine[J]. Journal of Management Sciences in China, 2006, 9(2): 1-8(in Chinese). [18] 陈华友. 基于预测有效度的组合预测模型研究[J]. 预测, 2001, 20(3): 72-73,68.CHEN H Y. Research on combination forecasting model based on effective measure of forecasting methods[J]. Forecasting, 2001, 20(3): 72-73,68 (in Chinese). [19] 陈华友, 刘春林. 基于IOWA算子的组合预测方法[J]. 预测, 2003, 22(6): 61-65.CHEN H Y, LIU C L. A kind of combination forecasting method based on induced ordered weighted averaging (IOWA) operators[J]. Forecasting, 2003, 22(6): 61-65(in Chinese). [20] 陈华友, 刘春林, 盛昭瀚. IOWHA算子及其在组合预测中的应用[J]. 中国管理科学, 2004, 12(5): 35-40.CHEN H Y, LIU C L, SHENG Z H. Induced ordered weighted harmonic averaging (IOWHA) operator and its application to combination forecasting method[J]. Chinese Journal of Management Science, 2004, 12(5): 35-40(in Chinese). [21] 陈华友, 盛昭瀚. 一类基于IOWGA算子的组合预测新方法[J]. 管理工程学报, 2005, 19(4): 36-39.CHEN H Y, SHENG Z H. A kind of new combination forecasting method based on induced ordered weighted geometric averaging (IOWGA) operator[J]. Journal of Industrial Engineering and Engineering Management, 2005, 19(4): 36-39(in Chinese). [22] 陈勤勤, 陈华友, 韩冰. 基于灰色关联度和Shapley值的区间组合预测模型及其应用[J]. 安徽大学学报(自然科学版), 2023, 47(4): 16-24.CHEN Q Q, CHEN H Y, HAN B. Interval combination forecasting model based on grey correlation degree and Shapley value and its application[J]. Journal of Anhui University (Natural Science Edition), 2023, 47(4): 16-24(in Chinese). [23] 张逸飞, 成晟, 韩一杰, 等. 整体与极端偏差之权衡: 一种改进的组合预测优化方法[J]. 系统工程理论与实践, 2023, 43(6): 1837-1851.ZHANG Y F, CHENG S, HAN Y J, et al. Trade-off between the global and extreme bias: an improved optimization approach in forecast combination[J]. Systems Engineering-Theory & Practice, 2023, 43(6): 1837-1851(in Chinese). [24] HU Y H, GUO Y S, FU R. A novel wind speed forecasting combined model using variational mode decomposition, sparse auto-encoder and optimized fuzzy cognitive mapping network[J]. Energy, 2023, 278: 127926. doi: 10.1016/j.energy.2023.127926 [25] ZENG L L, LING L W, ZHANG D B, et al. Optimal forecast combination based on PSO-CS approach for daily agricultural future prices forecasting[J]. Applied Soft Computing, 2023, 132: 109833. doi: 10.1016/j.asoc.2022.109833 [26] 聂铃, 张剑, 胡茂政. 基于CEEMDAN分解的短时交通流组合预测[J]. 计算机工程与应用, 2022, 58(11): 279-286.NIE L, ZHANG J, HU M Z. Short-term traffic flow combination prediction based on CEEMDAN decomposition[J]. Computer Engineering and Applications, 2022, 58(11): 279-286(in Chinese). [27] CHEN W, XU H L, CHEN Z S, et al. A novel method for time series prediction based on error decomposition and nonlinear combination of forecasters[J]. Neurocomputing, 2021, 426(22): 85-103. [28] THOMSON M E, POLLOCK A C, öNKAL D, et al. Combining forecasts: performance and coherence[J]. International Journal of Forecasting, 2019, 35(2): 474-484. doi: 10.1016/j.ijforecast.2018.10.006 [29] 张倩昀, 陈华友, 江立辉. 加权算术平均组合预测方法均方误差的分解[J]. 合肥学院学报(综合版), 2020, 37(2): 7-13.ZHANG Q Y, CHEN H Y, JIANG L H. Decomposition of mean square error of weighted arithmetic mean combined forecasting method[J]. Journal of Hefei University(Comprehensive Ed), 2020, 37(2): 7-13(in Chinese). [30] KANG Y F, CAO W, PETROPOULOS F, et al. Forecast with forecasts: Diversity matters[J]. European Journal of Operational Research, 2022, 301(1): 180-190. doi: 10.1016/j.ejor.2021.10.024 [31] 周传世, 罗国民. 加权几何平均组合预测模型及其应用[J]. 数理统计与管理, 1995, 14(3): 17-19.ZHOU C S, LUO G M. Weight geometric average combination forecast model and its applications[J]. Journal of Applied Statistics and Management, 1995, 14(3): 17-19(in Chinese). [32] 杨桂元, 唐小我, 马永开. 最优加权几何平均组合预测方法研究[J]. 统计研究, 1996, 13(2): 55-58.YNAG G Y, TANG X W, MA Y K. Research on optimal weighted geometric average combined forecasting method[J]. Statistical Research, 1996, 13(2): 55-58(in Chinese). [33] 王自成, 陈华友, 韩冰, 等. 基于TOPSIS的最大贴近度的最优组合预测模型及其性质[J]. 中国科学技术大学学报, 2019, 49(9): 751-761.WANG Z C, CHEN H Y, HAN B, et al. An optimal combination forecasting model based on maximum closeness of TOPSIS and its properties[J]. Journal of University of Science and Technology of China, 2019, 49(9): 751-761(in Chinese). -

 下载:
下载:


 点击查看大图

计量
- 文章访问数: 204
- HTML全文浏览量: 56
- PDF下载量: 6
- 被引次数: 0
